Compute color histograms of images
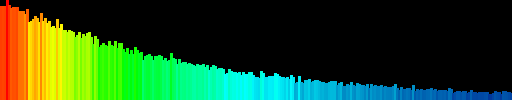
A histogram tells us the number of occurences of each value in our data. A histogram can be computed for each color channel of an image and can then be rendered into a graphical representation. A histogram allows us to see which values occur more often and which values are rare thus for example allowing us to determine whether an image has too much blue in it or is too dark, too bright and then correct this by adjusting the image to fit a better histogram.
The algorithm
proc hist(Image image, u32 channel) u32[]
begin
	u32[] hist := new u32[256]			; There are 256 different values 0..255
	for u32 y := 0 to image.height - 1 do
		for u32 x := 0 to image.width - 1 do
			hist[(x,y)][channel] += 1	; hist[(x,y)] returns pixels at (x,y) which is (r,g,b)
		end
	end

	return hist
end

proc render(u32[] hist) Image
begin
	u32 m := maximum(hist)						; Compute the maximum value
									; The most frequent value will have height 100
	Graphics g = new Graphics(512, 100)				; 512x100
	for u32 x := 0 to size(hist) do
		f64 p := f64(hist[x])/f64(m)
		u32 height := u32(p * 100)
		color clr := heatmap_color(p)				; Calculate the color for 0 < p < 1
									; If you don't know how to do this use any color you want. I'll cover
									; interpolation of colors in another article later.
		g.rect((x*2, 100 - h), (x*2 + 2, 100), clr)		; Draw a 2px wide rectangle of height h
	end

	return g.image()
end